


Sent From An Atmospheric Physicist
Location: Aus Timelapse On The East Coast In 2022- At The End You'll See The Waves In The Background. Many Examples From Ground, Satellite Etc. Or Regular/Specific Cloud Pattern Associated With Messing Up With Ionosphere The Evidence Lies In The Constant/Planned Manipulation Of The Atmosphere. Same Patterns Before, During, And After Extreme Weather- Floods, Storms, Etc.
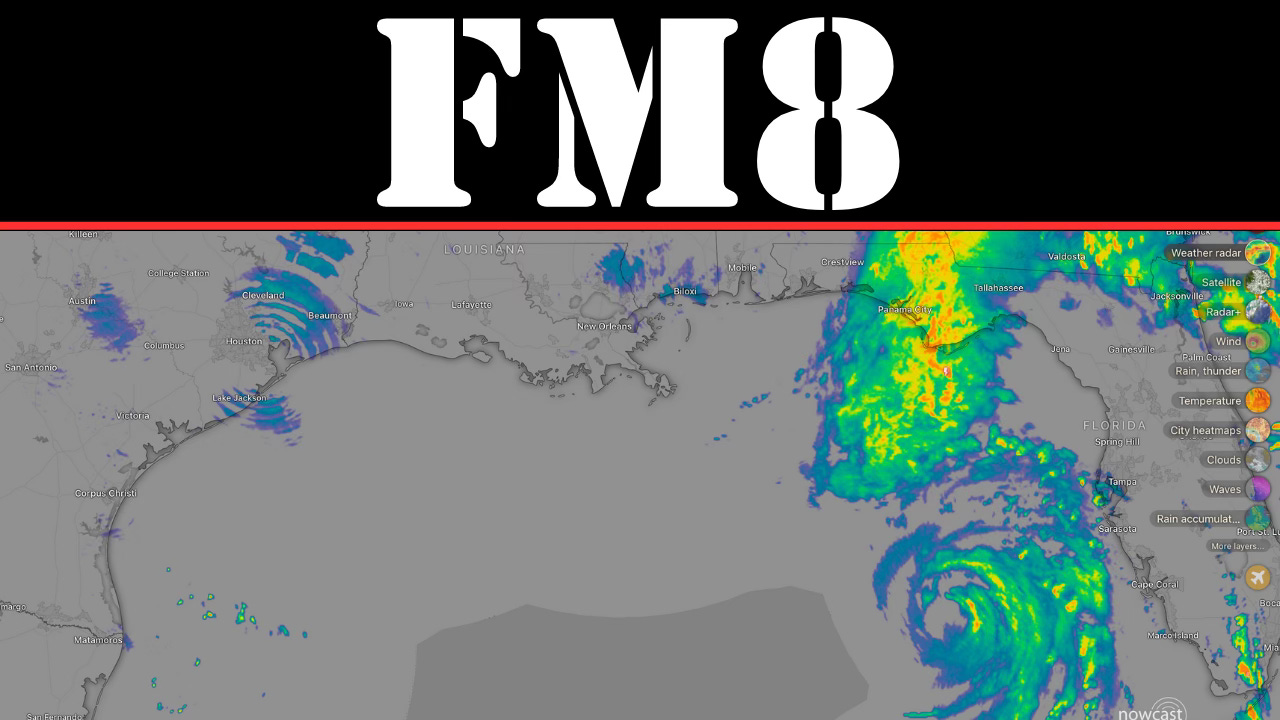
Weather App I Used For The Video: https://www.windy.com/-Weather-radar-radar?radar,28.135,-90.264,7,m:eF5ad0K
Crickets in Houston:
Micro Wave Patterns Can Explain How The Macro Works Over Our Heads:


Share this post